Food Bank Supply Chain
A Case Study of Washington, D.C.
1. Problem Statement
Food insecurity is a critical public health issue linked to malnutrition, chronic diseases, and reduced quality of life. It disproportionately affects homeless individuals, low-income families, children, and seniors.
In the Washington, D.C., area, thousands of residents face challenges in accessing affordable and nutritious food. Despite the efforts of emergency food providers and urban farms, significant gaps in food distribution and accessibility remain, particularly in low-income neighborhoods. A 2024 report from the Capital Area Food Bank revealed that 37% of households experienced food insecurity (Capital Area Food Bank, 2024).
To address this challenge, it is essential to establish an efficient food assistance supply chain that enables timely identification and accurate estimation of food insecurity while ensuring a smooth and robust logistics flow from supply to demand. Food banks, as central hubs of the food assistance distribution network, play a pivotal role in ensuring the effective delivery of resources. An efficient food bank network can effectively reduce food insecurity (Bazerghi, C., et al. 2016).
In this context, the key questions to be answered are:
- What will food insecurity rates be across different regions within the D.C. area in the coming years?
- How can we design and optimize the food bank distribution network to enhance the accessibility of food assistance?
This project aims to identify high-need areas with inadequate food access by 2030 and optimize the network of food banks, enabling targeted interventions that can alleviate food insecurity and support long-term food sustainability.
2. Methodology
To optimize the food bank network by 2030, estimating the food insecurity rate for that year is crucial. This requires identifying the socioeconomic determinants that have the most significant impact on food insecurity.
Drawing on insights from The Analytics of Operations Management and other resources, we have identified Multivariable Linear Regression as an effective model to pinpoint the most critical socioeconomic factors influencing food insecurity and their respective coefficients.
With these key factors identified and referring to historical census data from the D.C. area, we apply predictive models—such as Random Forest, Time Series, and Linear Regression—to forecast their values for 2030. By combining the findings from these steps, we predict food insecurity levels in the D.C. area by 2030. These predictions serve as the foundation for designing an optimized food bank network.
Methodology Flow
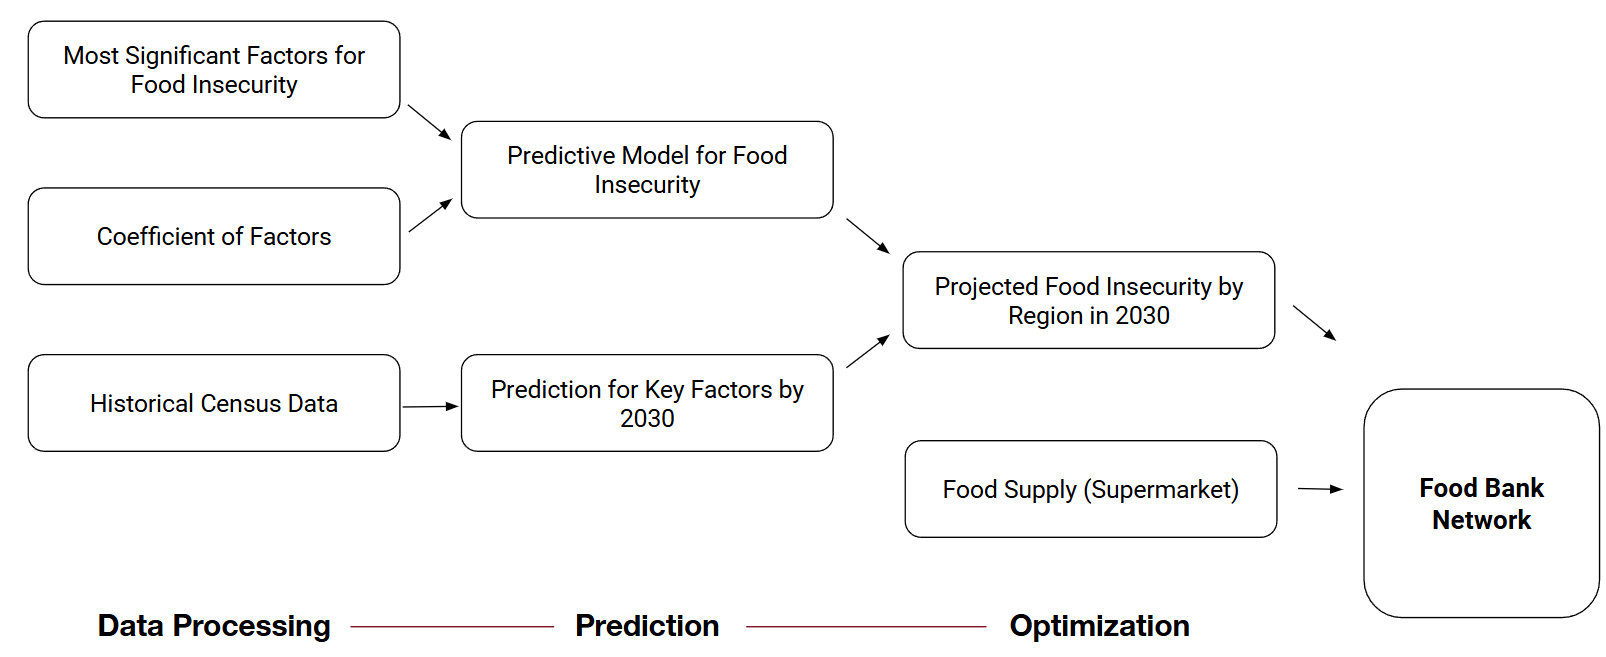
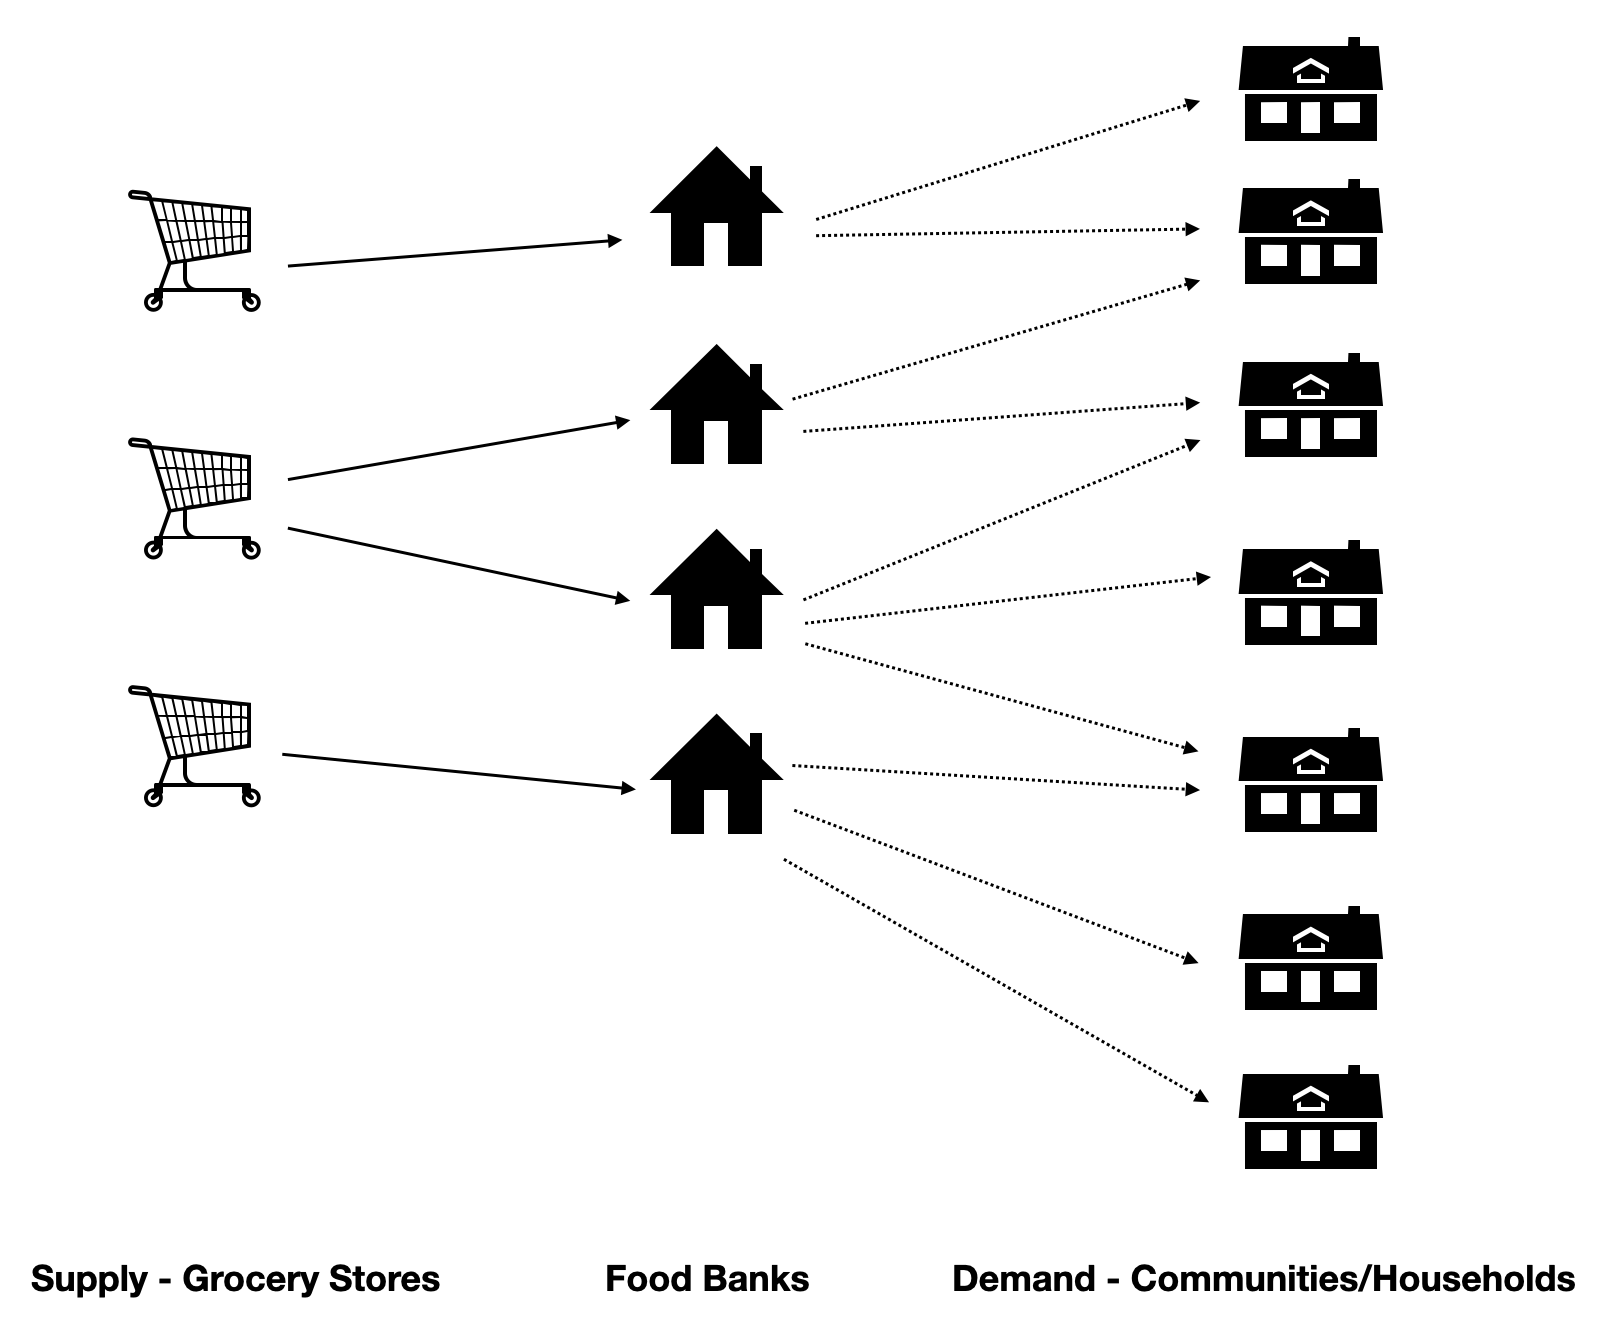
To design and optimize the food bank network, it is critical to understand both demand and supply.
- Demand refers to the location and food insecurity rate of communities and households vulnerable to food insecurity. We identify this using predictive models.
- Supply refers to the location and capacity of grocery stores that serve as sources for food banks. We obtain this data from publicly available information.
With both supply and demand data, we use Gurobi to solve a mixed-integer programming problem and determine the optimal locations for food banks.
Food Bank Network
3. Datasets
Based on the pre-defined methodology, the following datasets are utilized for this project:
- Capital Area Food Bank Hunger Estimates: Provides data on hunger and food insecurity by region, along with demographic and socioeconomic information.
- Historical Census Data: Identifies changes in the low-income population and other factors that significantly impact hunger levels.
- Washington, D.C., Grocery Store Data: Includes information on grocery store locations and their capacities.
- Washington, D.C., Affordable Housing Data: Contains location information for low-income communities and households.
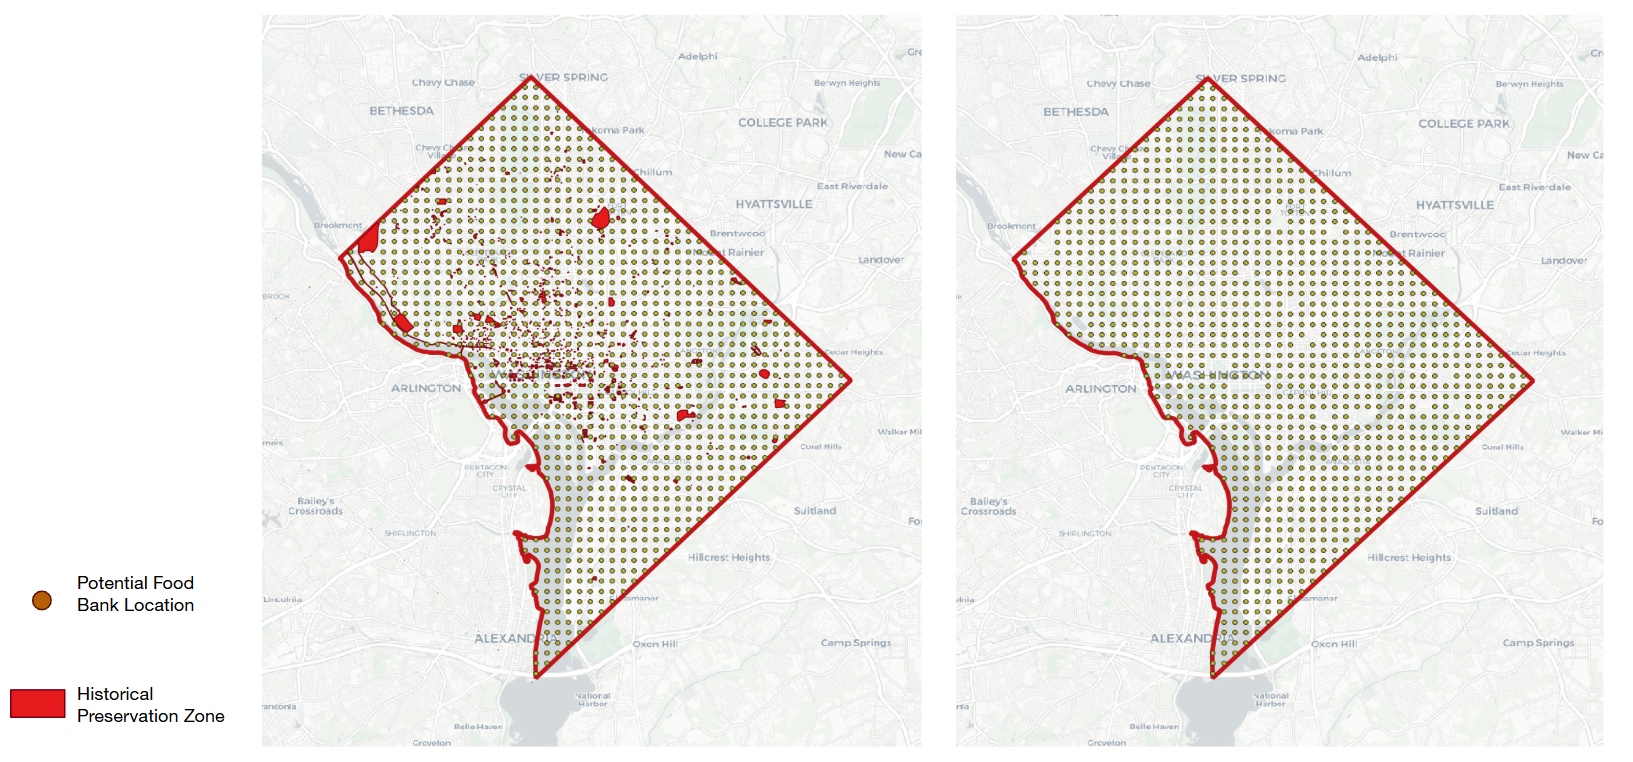
- Washington, D.C., Historical Landmark Boundary Data: Highlights areas unsuitable for establishing new food banks due to preservation restrictions.
- Capital Area Food Bank Emergency Food Provider: Locations of Capital Area Food Bank (CAFB) programs and public partners in the DMV (DC, Maryland, and Virginia).
To address missing data in the datasets, particularly in the Historical Census Data, we generally use the average value of the respective variable to fill in the gaps; this ensures a consistent dataset for analysis. For outliers, we exclude the associated records to prevent them from distorting or contaminating the results. This approach helps maintain data integrity and improves the reliability of our analysis.
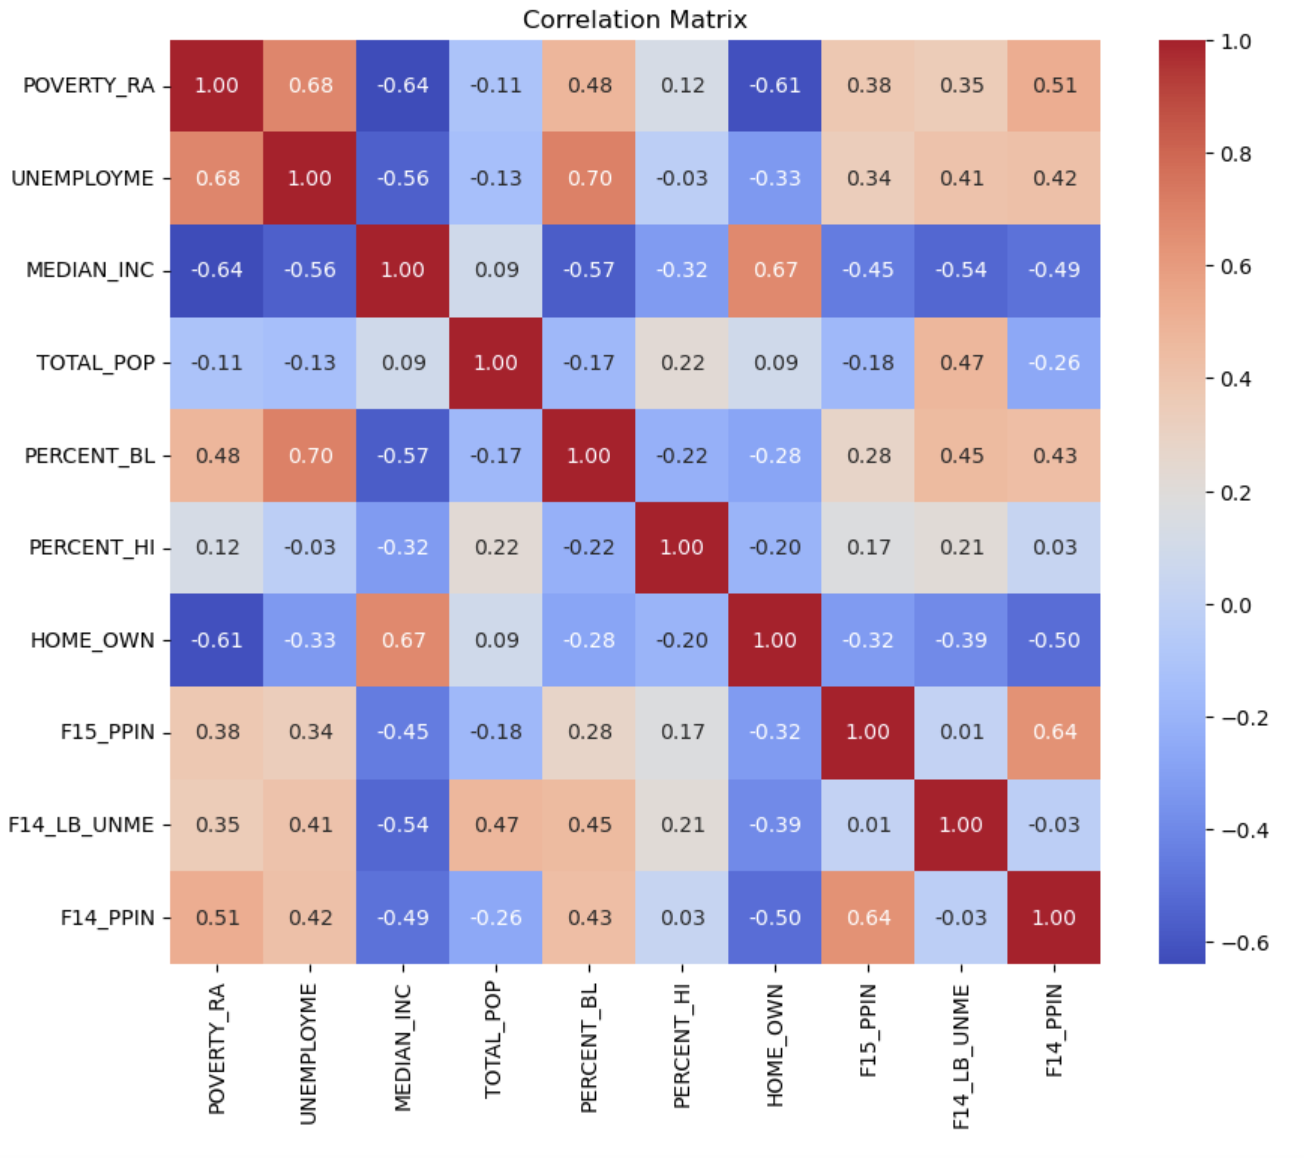
Correlation Matrix
Multivariable Linear Regression Model
Low-Income Housing Location Clustering
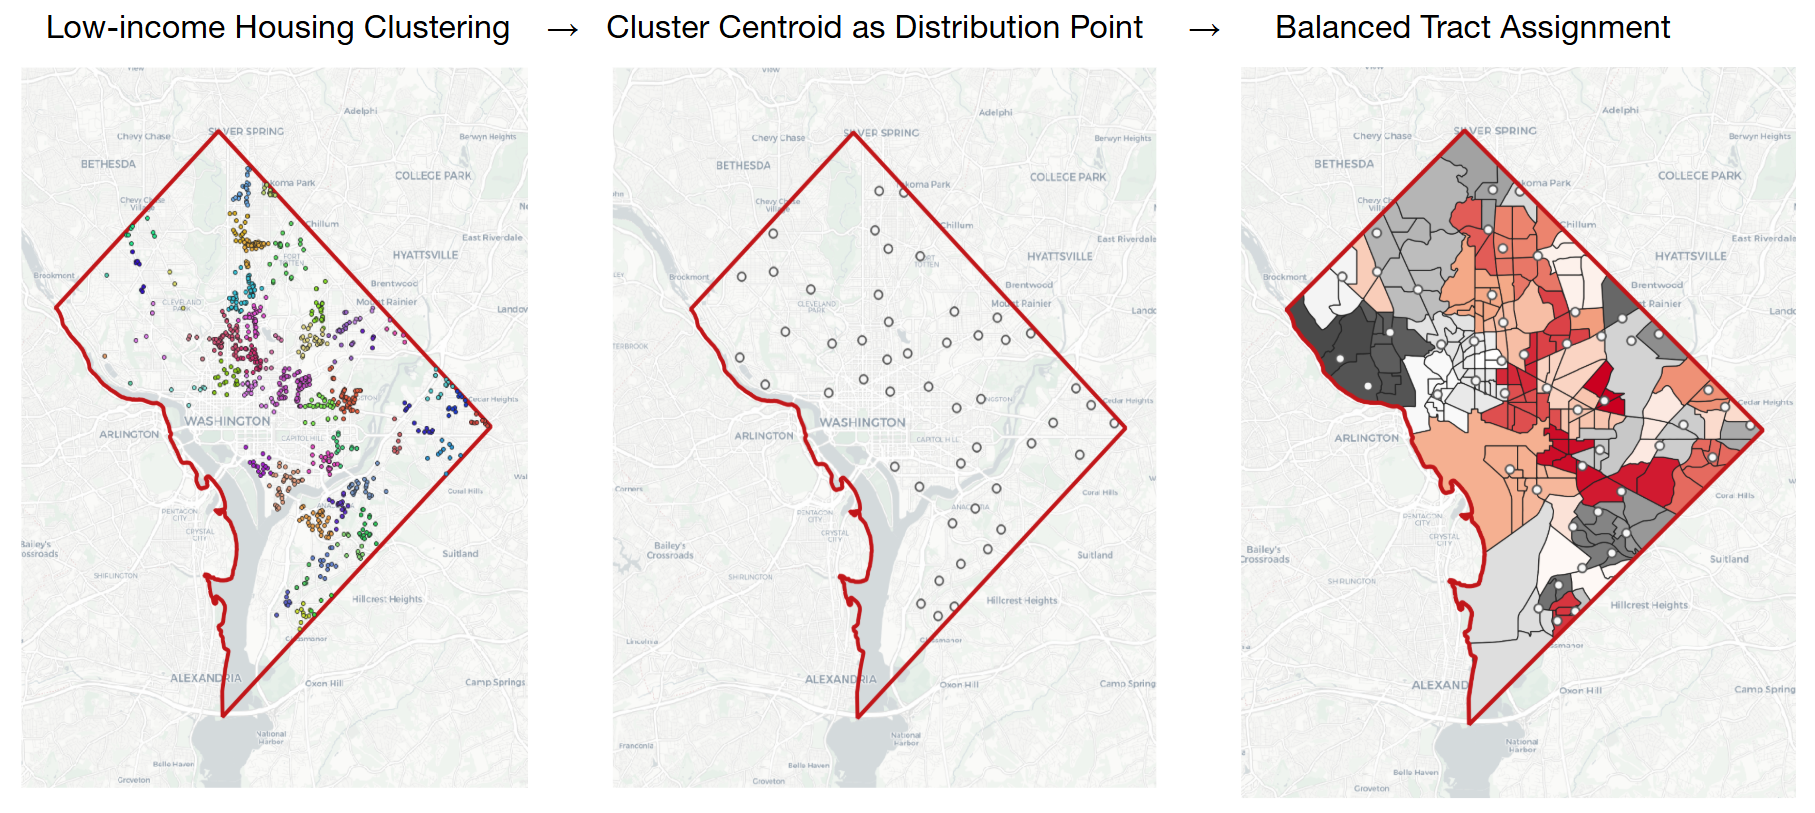
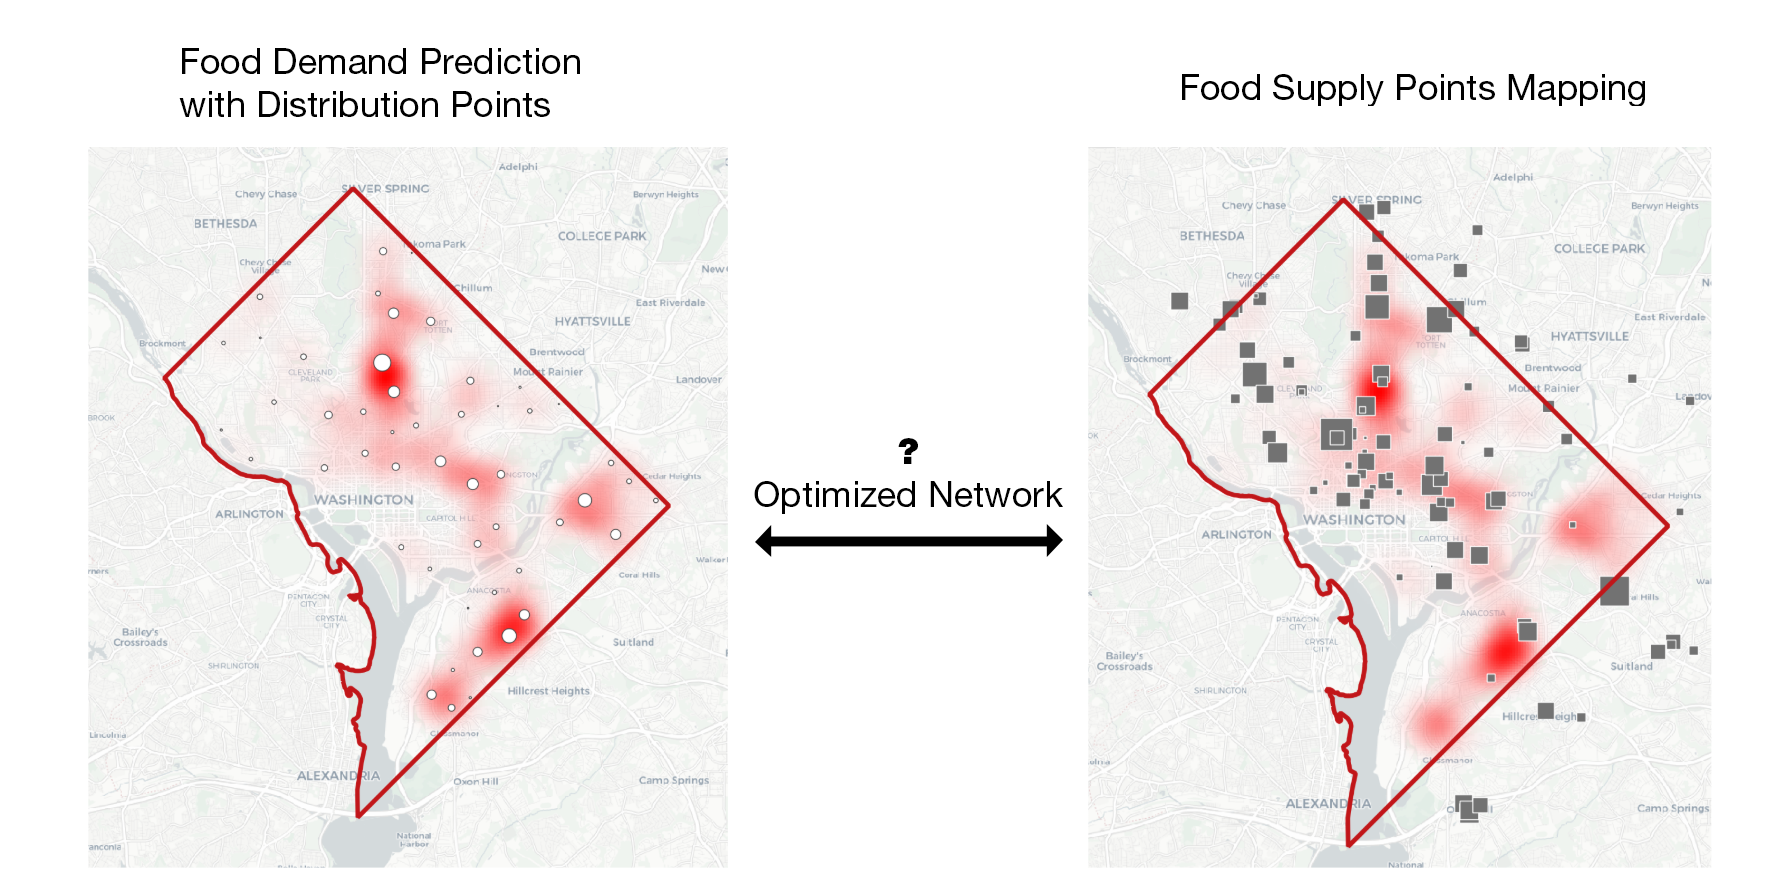
Mapping of Supply and Demand Locations
Potential Food Bank Location
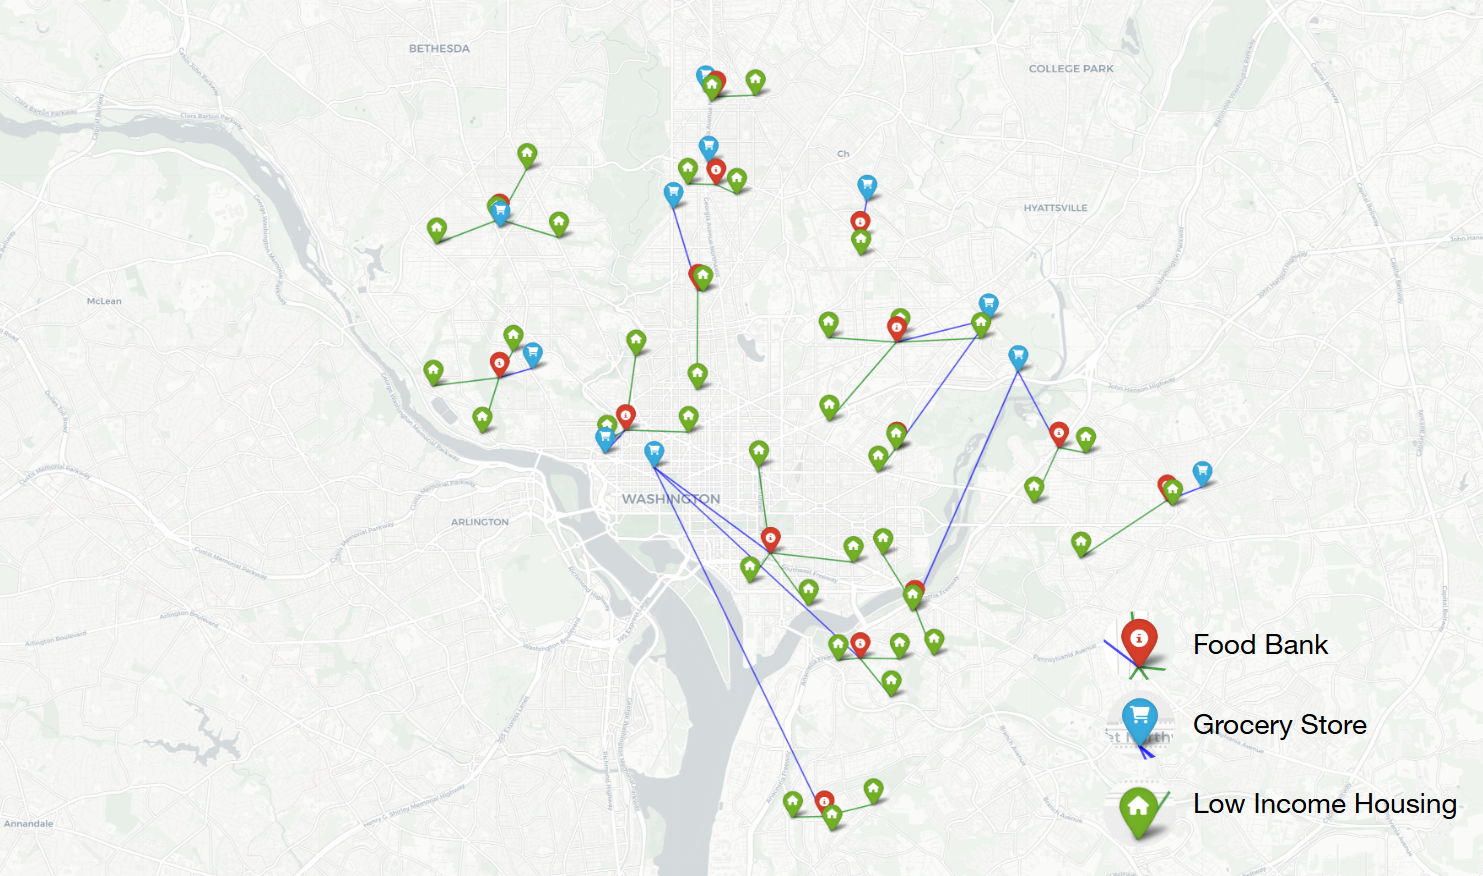
Optimization Result Visualization
Conclusion
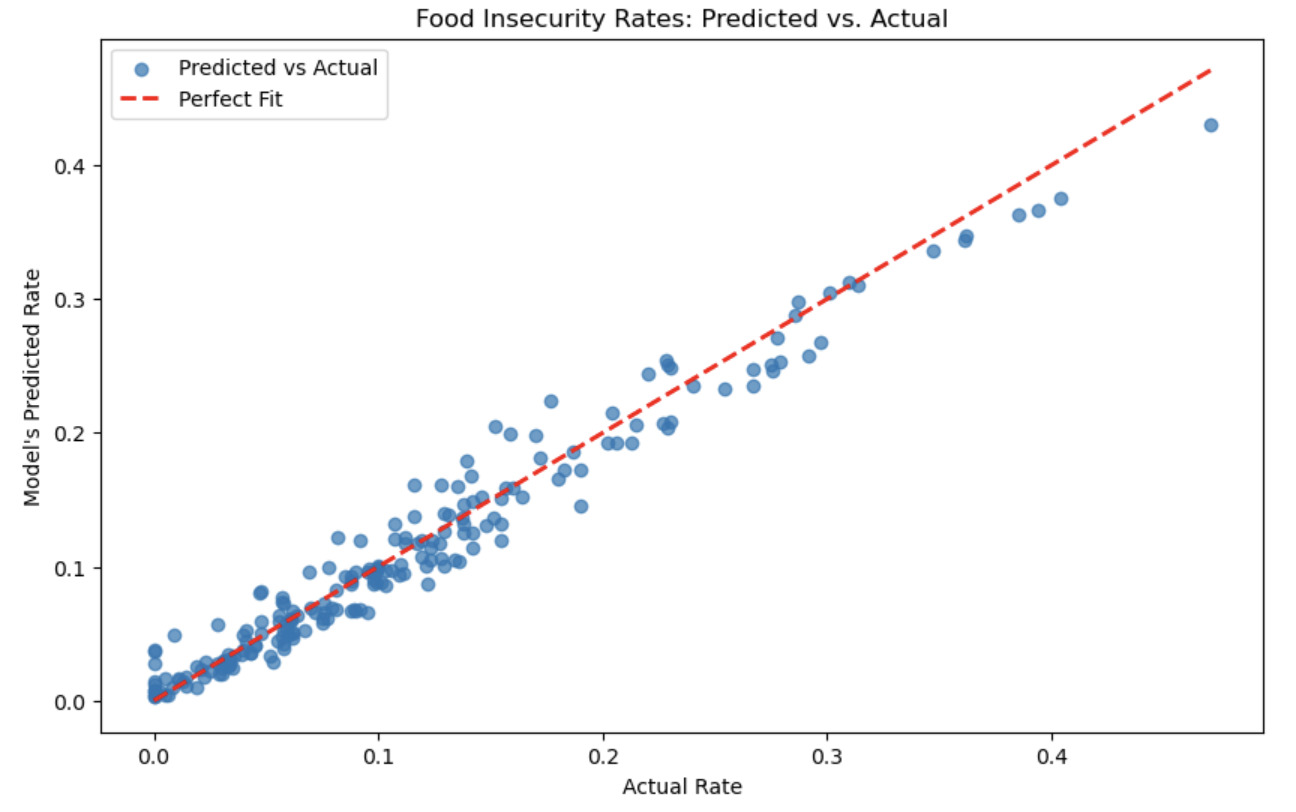
Our project introduces an optimization workflow designed to address food insecurity in the Washington, D.C., region by leveraging predictive modeling and network optimization. We use a multivariable linear regression model to predict food demand with high accuracy, achieving an R² value of 0.96287. This model incorporates key socioeconomic indicators such as unemployment rates, poverty levels, racial demographics, and home ownership.
Building on this, we extend the single-year, tract-level food demand dataset into a multi-year forecast using historical census data. This predictive model serves as the foundation for our food bank location optimization problem to estimate future food demand.
The optimization model effectively addressed the food bank network design problem by minimizing transportation distances while adhering to multiple constraints. These constraints included historical preservation zones and demand-balanced food distribution points. Our model provided an acceptable level of abstraction of real-world constraints while keeping the feasibility of solving numerically using the solver.