Multi-Purpose Autonomous Vehicle Simulation
Collaborators: Chance Jiajie Li, Jin Gao, Ziyi Tang, Trent Tepool, Hiromu Ryan Rose
Shared Mobility in Kendall Square, GAMA Days 2022
Abstract
The goal of this multi-agent simulation is to predict a low-carbon and efficient transportation system to shift the usage and reliance on high fossil fuel consuming vehicles to multi-purpose vehicles, to shape what an optimal transportation system in the future will look like. To accomplish this, we will introduce a Multi-Purpose Autonomous Vehicle (Multi-Purpose Autonomous Vehicle Simulation).
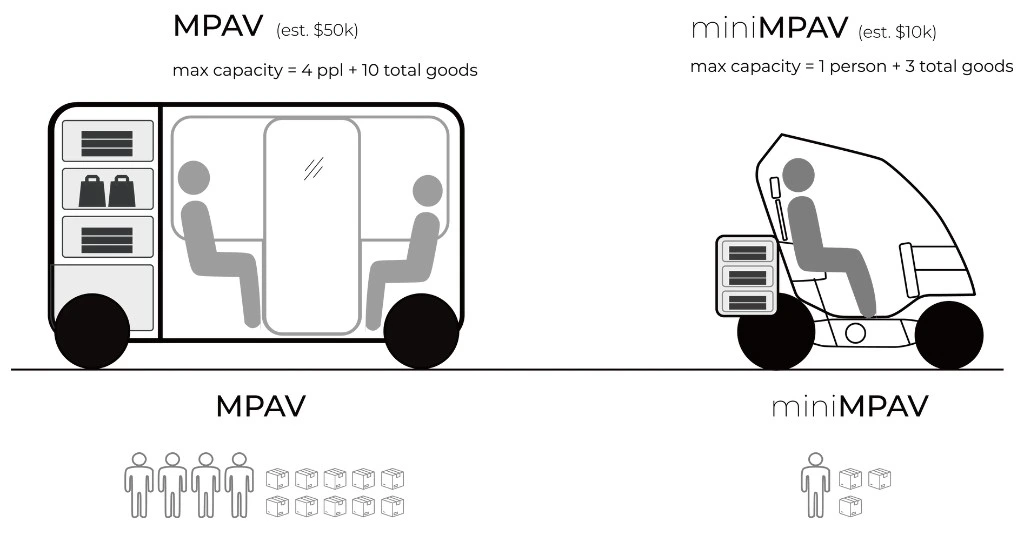
Based on a modular design strategy, the Multi-Purpose Autonomous Vehicle Simulation is able to do tasks such as cleaning waste and delivering commercial goods. For the simulation, we simplified it to carrying people and goods(parcels and food) with two capacities. stakeholders.
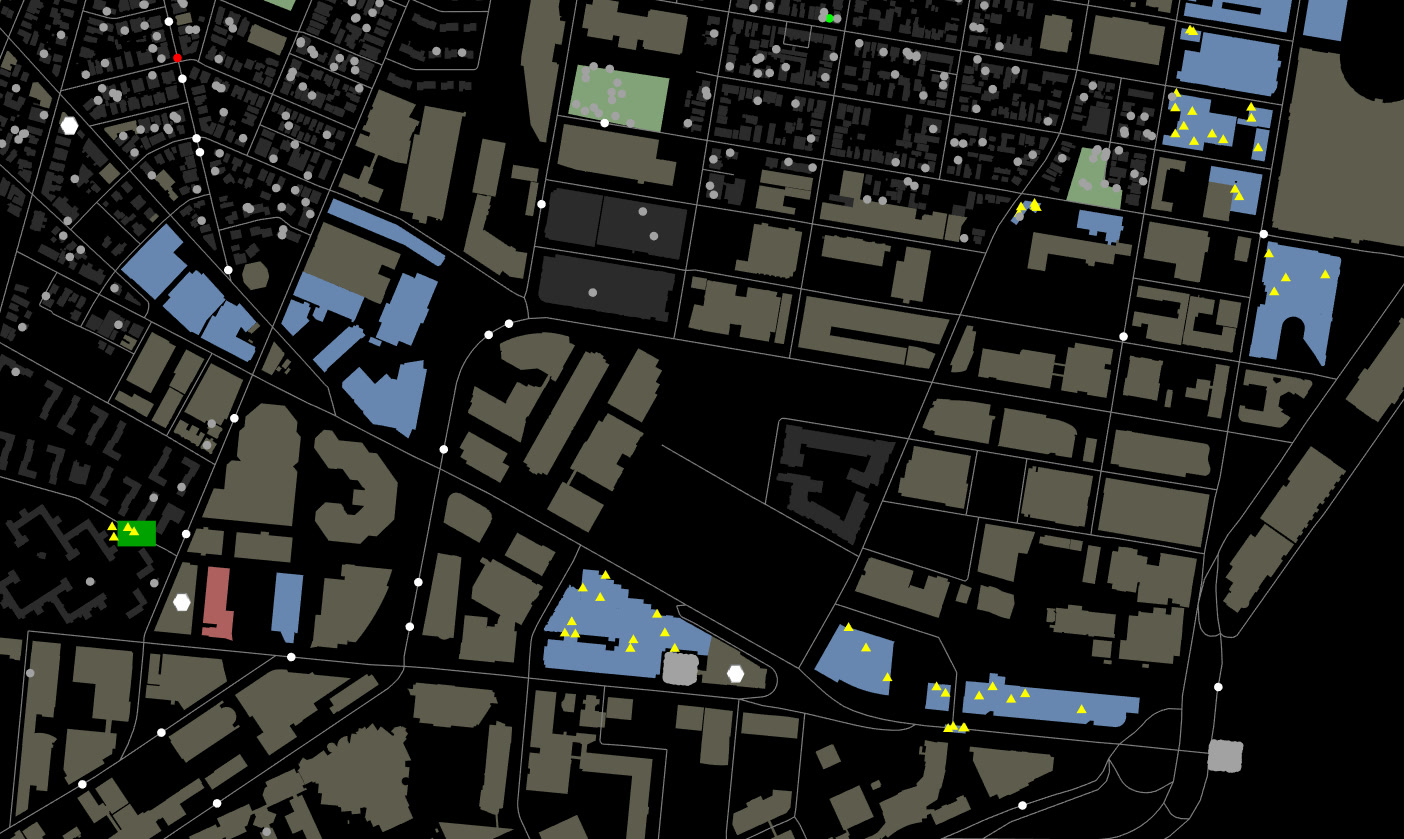
We choose Kendall Square as a representative site for the future entrepreneurship innovative city, for it gathered a large number of high-tech enterprises that generate huge demand for parcel and food delivery from companies and commuters. Through simulation, we hope to find a balance between existing transportation options, Multi-Purpose Autonomous Vehicle Simulations, and potentially other future modes of transportation to meet the transportation demands of the people of Kendall Square.
Method and findings
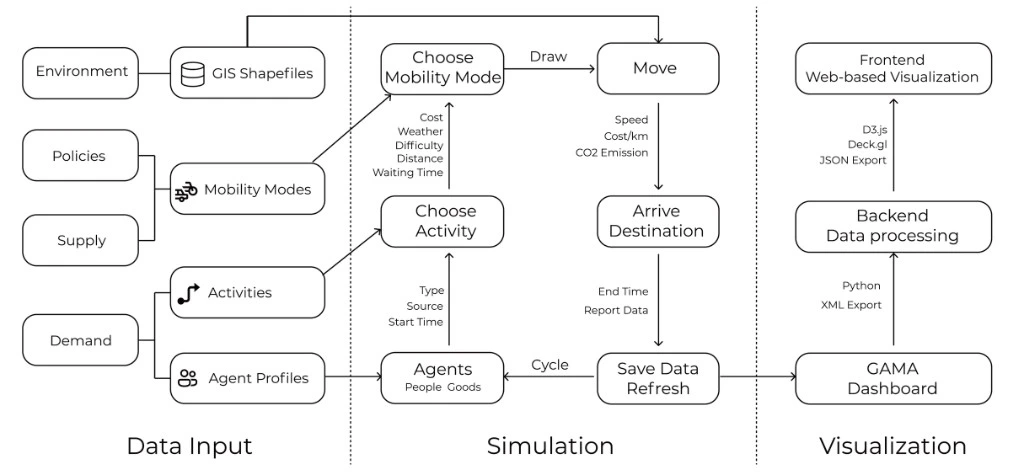
The Kendall Square Multi-Purpose Autonomous Vehicle Simulation study runs an agent-based model in GAMA: GIS and demand inputs feed trip and mode choices, loops update agent positions and outcomes, then results flow to dashboards and a web stack for exploration. Below, the pipeline is shown end to end alongside the Multi-Purpose Autonomous Vehicle Simulation versus miniMulti-Purpose Autonomous Vehicle Simulation capacity assumptions and the map legend used in runs.
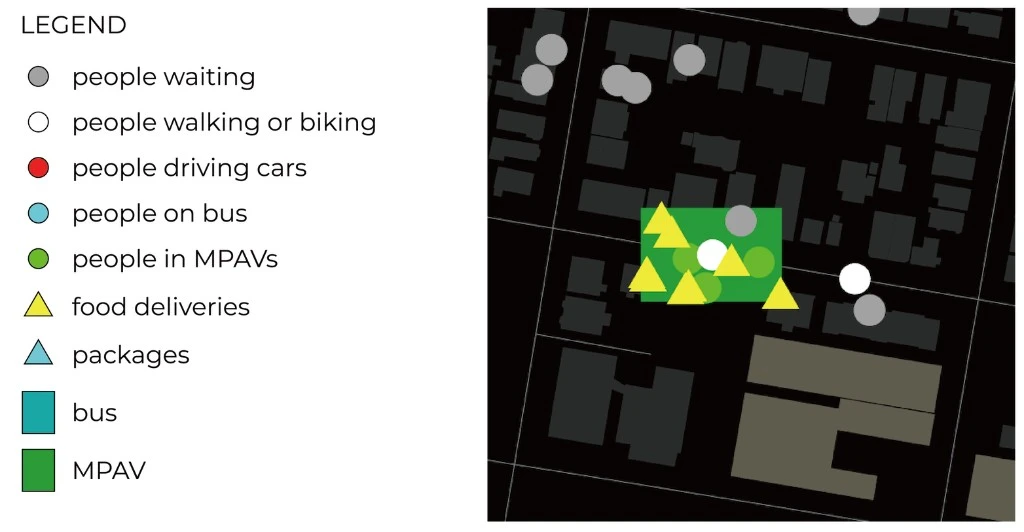
Agent-based Traffic Modeling
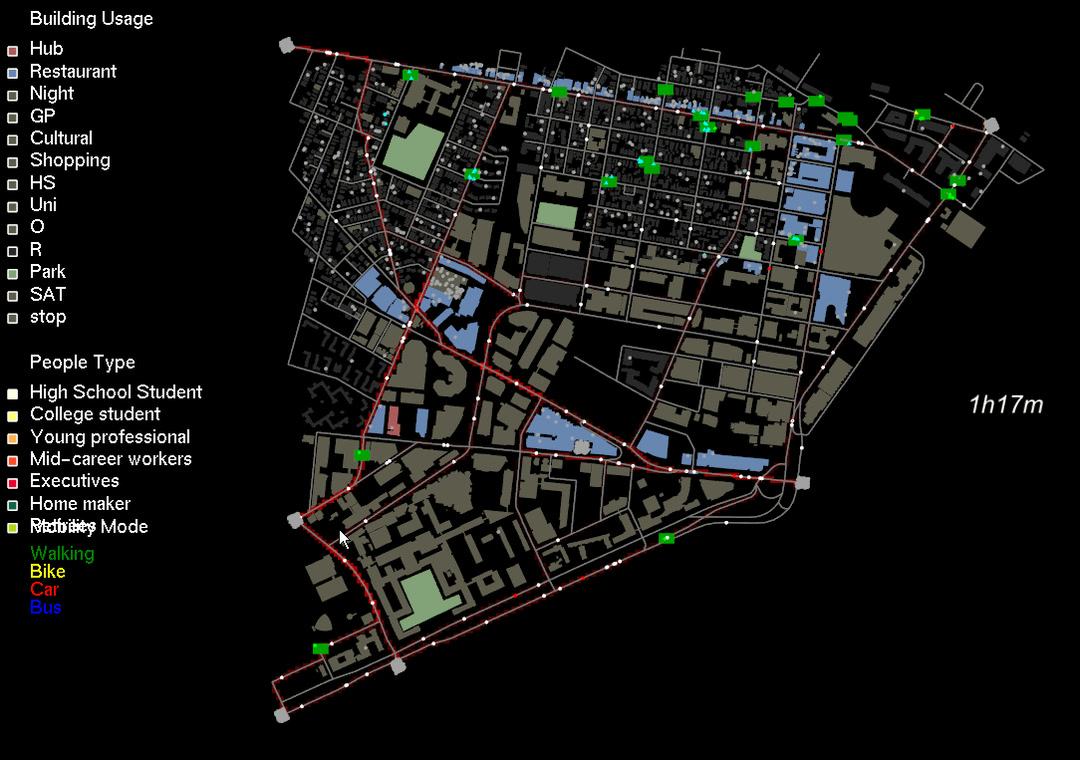
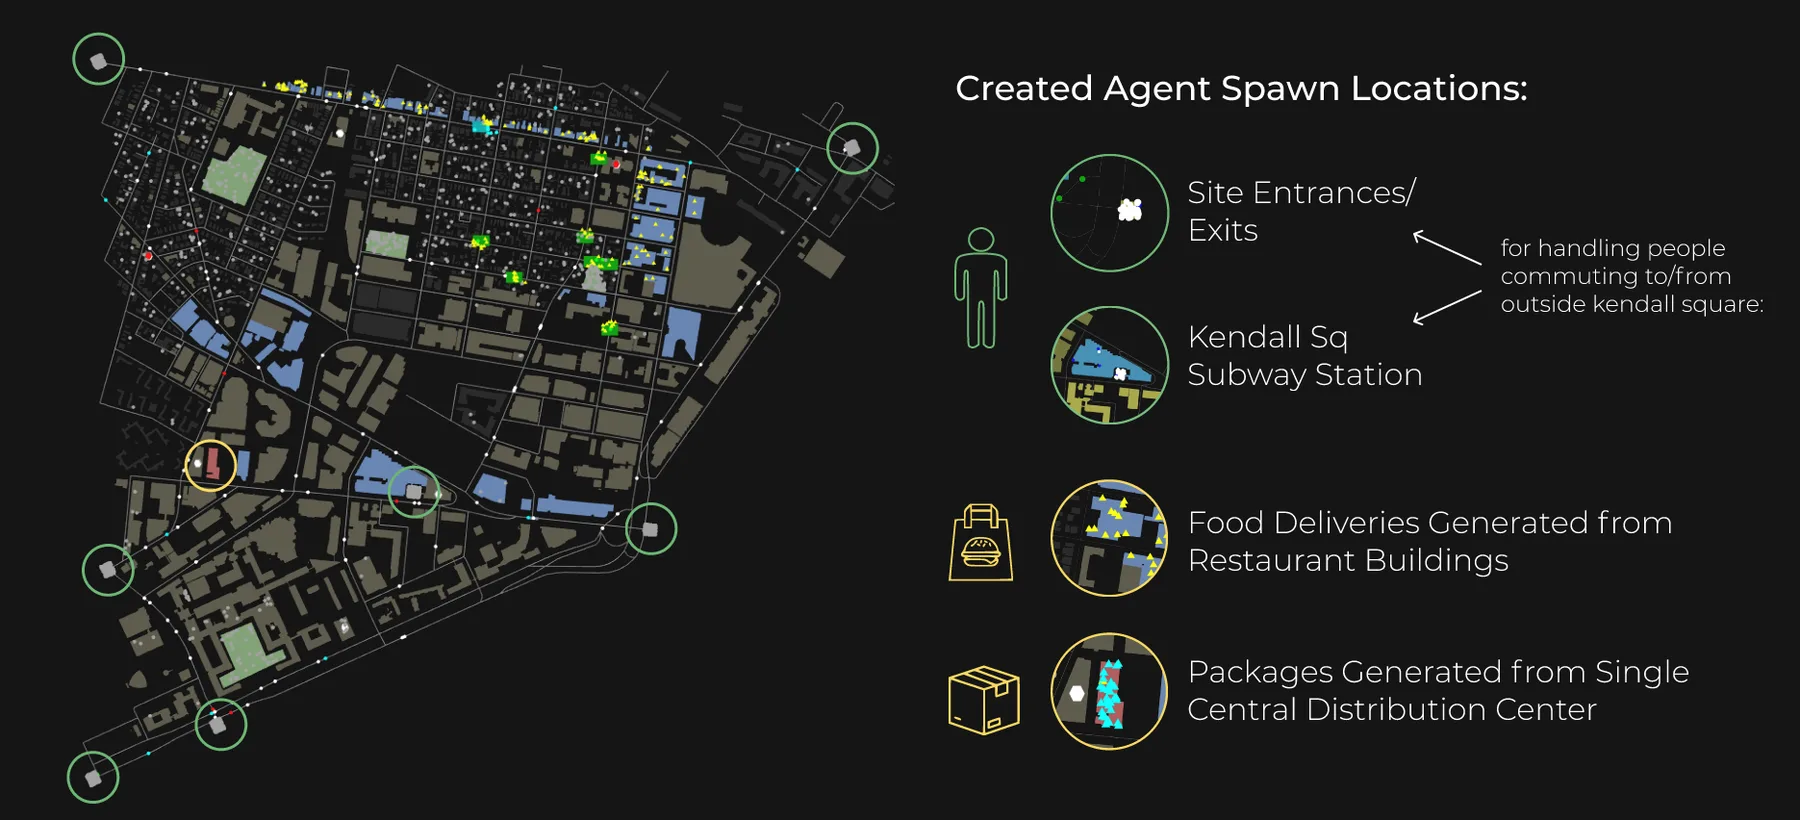
Experiments
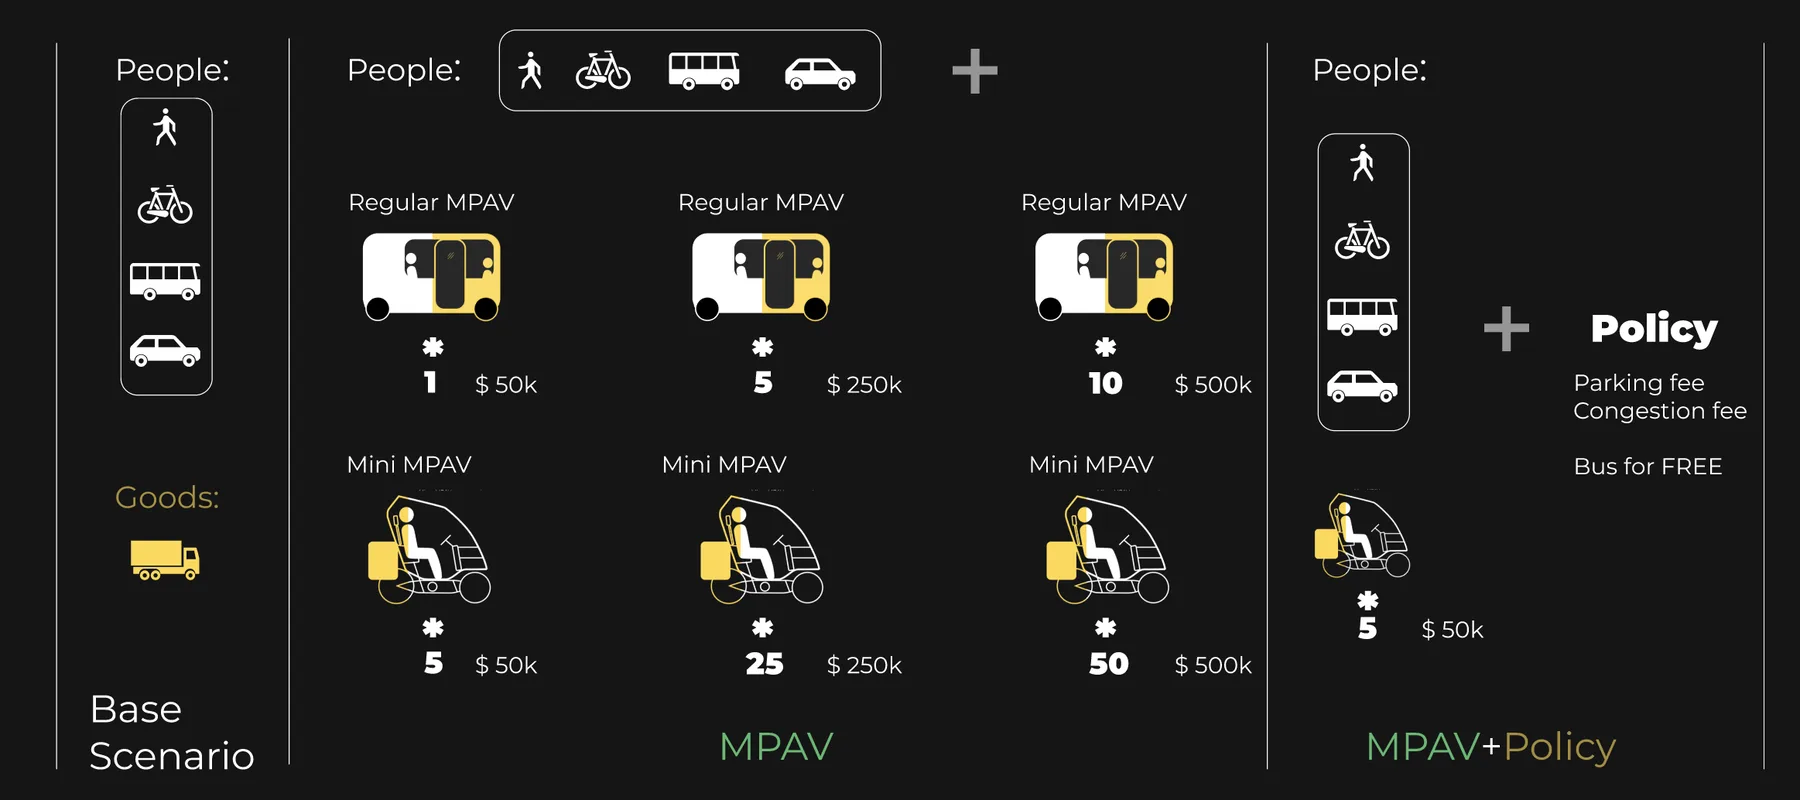
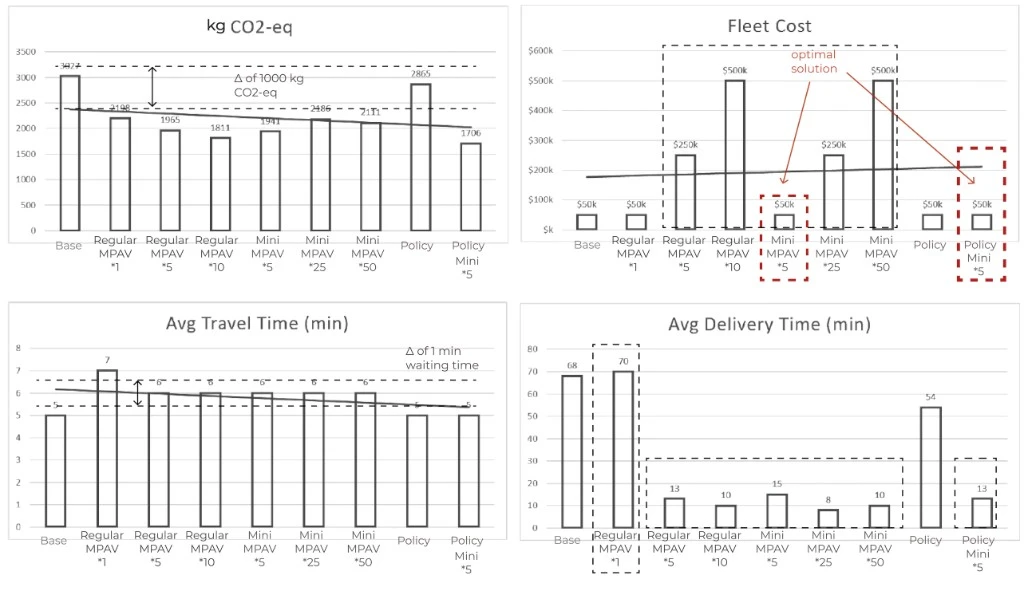
Results
Conclusions
- All Multi-Purpose Autonomous Vehicle Simulation based solutions save ~1000 kgCO2-eq even if the average travel time for vehicles increases by 1 min (5 min → 6 min)
- All solutions involving Multi-Purpose Autonomous Vehicle Simulations (except 1 Multi-Purpose Autonomous Vehicle Simulation) drastically reduce delivery times by ~1 hour
- Optimal solution based on the above and fleet cost is 5 miniMulti-Purpose Autonomous Vehicle Simulations ($10k × 5 = $50k) due to the small area of Kendall Square